


Risk Parity Optimization, Modern Portfolio Management
How and why it works

In this analysis, we'll dive into Qian's (2005) work on risk parity optimization and discuss a couple of papers:
"The Trend is Our Friend: Risk Parity, Momentum, and Trend Following in Global Asset Allocation" by Clare, Seaton, Smith, and Thomas
"Leverage Aversion and Risk Parity" by Clifford S. Asness, Andrea Frazzini, and Lasse H. Pedersen
Let's start by talking about what optimization is, and we'll look at some examples from the papers and current backtests that I'll provide.
Risk parity is a way to build a portfolio by weighting each asset so that the risk contribution of each one is equal across the entire portfolio. This means that more volatile assets (like equities) get less allocation, while less volatile ones (like bonds) get more. To do this, we take the inverse of each asset's volatility (using a rolling window), then normalize it so that the weights add up to 1.
Mathematically, we can solve for this objective:

RC is the risk contribution of each asset (in this case, 2) to the overall portfolio. We’re looking for weights (W) that can essentially reduce the formula to zero, assuming we can’t short sell or use leverage.
So, without further ado, we can easily code this function in Python. The output looks like this:

We rebalance each month, which makes sense. IEF is an ETF consisting of 7-10 year Treasury bonds, and SPY is the S&P 500 ETF. Since bonds have lower volatility, we need to allocate more towards IEF and less towards SPY to equalize the risk contribution.
To make the results comparable, the second paper mentioned multiplies the weights by a volatility target, which is the benchmark volatility. This keeps all the portfolios at the same overall risk level.
The return is as follows:

They also compare all results with an efficient frontier which I find very informative:
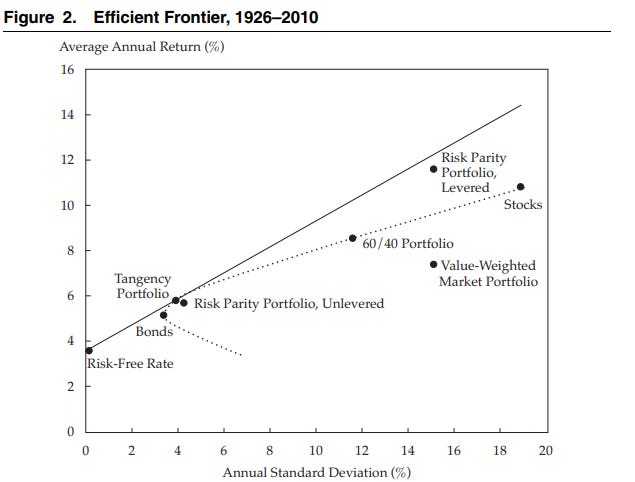
The dotted line represents the efficient frontier, and the tangent portfolio is the one that maximizes the Sharpe ratio along this frontier. The unleveraged risk parity portfolio is closer to this tangent. However, by leveraging the portfolio to match a benchmark—apparently, in this case, the Value-Weighted Portfolio (with the same standard deviations)—they were able to move beyond the efficient frontier and achieve higher risk-adjusted returns than the benchmark.
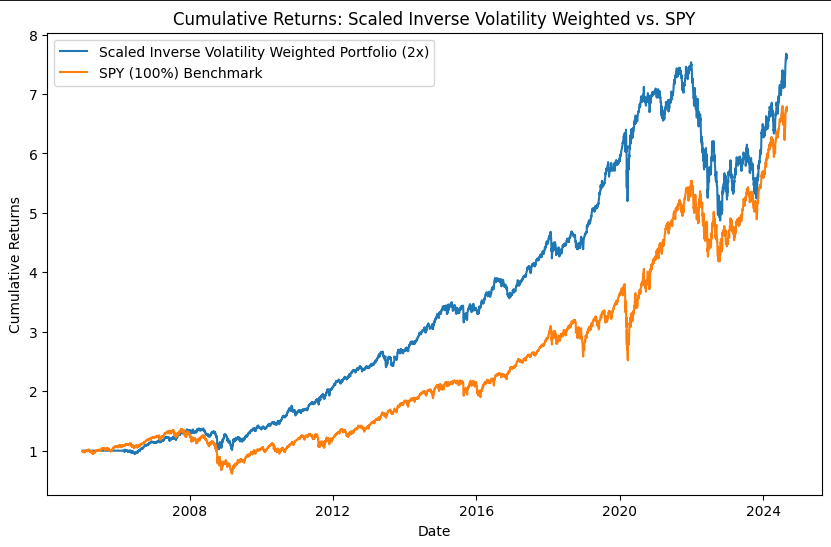
Now, I’m going to try to reproduce this result using current data. In my analysis, I'll leverage the risk parity portfolio by 2x and see the results. It’s an arbitrary number, but we can discuss that.
Results:
Metrics:

Max Drawdown Plot:
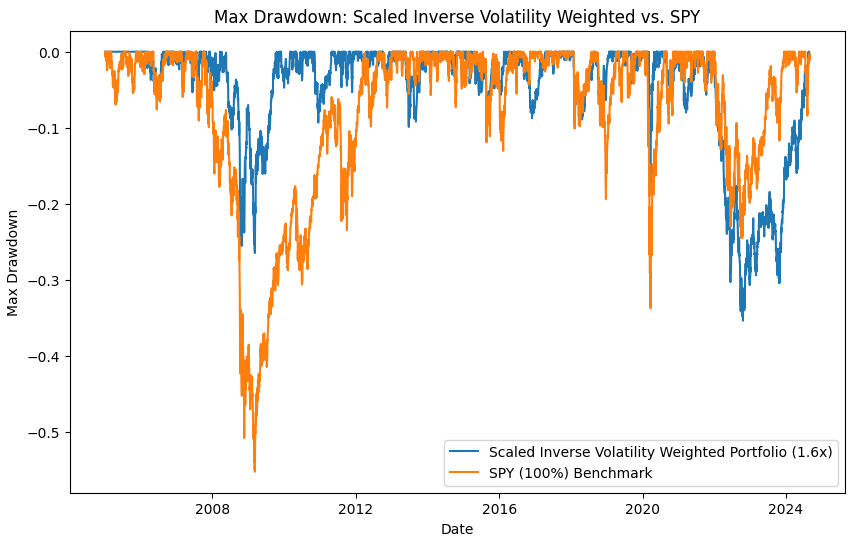
At first glance, this seems pretty compelling—much higher risk-adjusted returns (a Sharpe ratio of 0.8 compared to 0.55), with a higher CAGR and lower drawdown. But what happened in 2022?
2022 was marked by rising inflation, increasing interest rates, and market turmoil across both equities and bonds—a scenario we hadn't seen in a very, very long time. However, like my critique of Risk Parity, assuming a linear relationship between returns and volatility is flawed. If you bought bonds when interest rates were 1-2%, knowing that 30% of GDP was printed out of thin air, well, I have some news for you. That’s exactly what happened—bond rates were bound to go up, making them extremely inflated, and rising interest rates crushed the market. Especially with bonds, yesterday is not tomorrow. We’re now looking at 5% rates for the long term, with the market rallying. So, can we assume Risk Parity will outperform in a recession? I think it’s likely.
The Problem
The optimization doesn’t take expected returns into account, which might seem okay at first since we’re looking at a basket of equities (S&P 500) and a basket of bonds (IEF). There’s a sort of normal distribution where we can generally say that higher volatility leads to higher returns. But if we change the environment—like the asset selection universe or the bond scenario in 2022—Risk Parity might underperform significantly. In 2022, bonds were nearly worthless, and equities had very high multiples.
However, Risk Parity does benefit from the low beta anomaly, where low beta stocks tend to outperform higher beta ones in terms of Sharpe ratio.
We can also try to optimize the returns by Trend following, basically choosing when we select the asset in the portfolio using a 12 month crossover:
I wouldnt trade this, specially looking after 2016, because as market goes down, you assign more weights to bonds, and miss the markets rally. But you can remove 2022 turmoil, although rather pointless now.
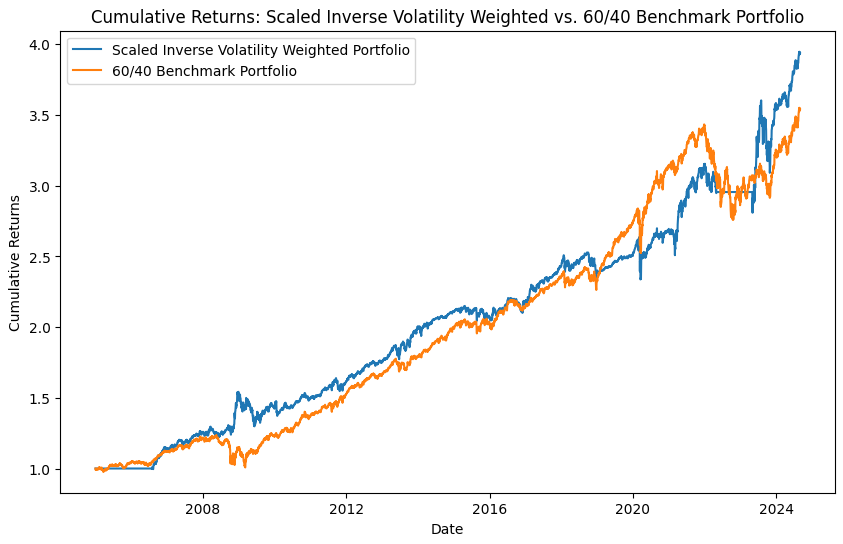
You can also somewhat think about Risk Parity as a 60/40 with leverage and volatility target, where you assign more weights to safer asset as the market is riskier.